
I have lots of to-do items on my plate lately, so naturally I have been distracted by the latest anti-vaccine bullshit. The regular crowd is abuzz with the news of a new study preprinted on preprints.org, a platform owned by MDPI. The preprint, posted 25 July 2025, is titled “Synthetic mRNA Vaccines and Transcriptomic Dysregulation: Evidence from New-Onset Adverse Events and Cancers Post-Vaccination”.
[ UPDATE: On 11 September, 2025, this preprint was withdrawn by MDPI. Scroll to the bottom of this post for more information. ]

One of the authors, Nicolas Hulscher, posted this illustrative video on Twitter/X:
In another post, retweeted 4,000+ times, Hulscher claims:
Using high-resolution RNA sequencing on blood samples, we discovered that COVID-19 “vaccines” SEVERELY disrupt expression of THOUSANDS of genes—triggering mitochondrial failure, immune reprogramming, and oncogenic activation that can persist for MONTHS to YEARS post-injection.
Differential gene expression analysis compared mRNA-injured patients (cancer, adverse events) to 803 healthy controls — revealing widespread transcriptomic CHAOS:
…
To our knowledge, this is the first study to show long-term genetic disruption in people harmed by the COVID-19 “vaccines”.
In the preprint, the authors claim to perform RNA sequencing (RNA-seq) of peripheral blood on
- Group 1, three patients “who developed new-onset post-vaccination symptoms” not including cancer, which I’ll call the adverse events group,
- Group 2, 7 patients who were “diagnosed with cancer as a new-onset condition within a short time frame following mRNA vaccine administration”, which I’ll call the cancer group,
- and a “cohort of 803 healthy individuals” as a control group.
They perform differential expression analyses (i.e., measure the expression levels of all genes) between the adverse events group and the control group and the cancer group and the control group and claim that genes related to oncogenesis and systemic inflammation are upregulated (i.e., they have a higher expression level) against control.
I’m bothered by credentialism in science but I’m not above it: I spent a large part of my PhD thesis working with RNA-seq data and could be called an expert bioinformatician. Here’s everything that I think is wrong with this preprint, in no particular order (also see Elisabeth Bik’s writeup on this preprint).
[The spirit of transparency compels me to disclose that I received a grant from Moderna for a project titled “Identifying bias and improving reproducibility in RNA-seq computational pipelines”. This grant, awarded through Moderna’s Global Fellowship Program, supported my salary between August 2023 and May 2025 and paid for travel to two conferences.]
1. The study design does not make sense
If you wanted to perform a study assessing if transcriptional changes related to cancer onset occur after COVID-19 vaccination, it would make sense to construct a control group of subjects that were not vaccinated and a treatment group of subjects that were vaccinated and compare the gene expression profiles of these groups, with particular attention towards gene expression patterns related to oncogenesis (e.g., increases in the expression of known oncogenes, decreases in the expression of tumor suppressor genes). You could also construct a cohort and assay their gene expression before and after vaccination (with the time point before vaccination analogous to an experimental control). Plenty of published sequencing studies about vaccine response use one or more of these study designs (1, 2, 3, 4). The primary outcomes for these studies are gene expression changes as a result of vaccination. If you were interested in cancer or other adverse events, these could be secondary outcomes that you also measure between your treatment group and an appropriate control group. If you want to test if vaccines cause cancer via transcriptional changes, knowing if cancer onset is more frequent in your control group versus your treatment group would be pretty important.
This study does none of these things. They claim to construct one control group without adverse events and compare it to two case groups, one with unspecified cardiovascular and neurological symptoms and one with unspecified cancers. Notably, the preprint never mentions if the subjects in the control group are vaccinated—they are only ever referred to as “healthy”. This is a particularly critical detail to omit from the preprint!
In a video podcast interview streamed the same day the preprint was posted, Hulscher states that the control group is composed of “pre-COVID blood samples” (i.e., they were not yet vaccinated). Focusing on the cancer group: if the control group was indeed unvaccinated, the independent variable being investigated by comparing the cancer group with the control group is not vaccination, but vaccination along with cancer. If the control group was vaccinated, the independent variable being investigated by comparing the cancer group with the control group is not vaccination, but cancer.
Either way, if you are going to observe any transcriptional changes between these groups at all, some of them are going to be related to cancer, not because the vaccine caused the cancer, but because you are comparing a group of people with cancer to a group of people without cancer! If you construct a study where the control group is people that did not eat an ice cream sandwich and the case group is people who ate an ice cream sandwich and drowned after, any differences you observe between the two groups would probably be related to the drowning and not the ice cream sandwich. Further, it would be ludicrous to use any difference you observe to claim that ice cream sandwiches cause drowning (do note that the Medical Establishment appears to be actively censoring this subject).
2. The case groups are very small
The cancer group (n=7) and the adverse events group (n=3) are very small in comparison to the control group (n=803). Small sample sizes severely dilute the power of statistical comparisons, particularly for RNA-seq. Schurch et al. (2016) recommend an absolute minimum of six biological replicates per experiment and a minimum of twelve for recovering a majority of all genes that are actually differentially expressed. Having this few replicates per condition gives a lot of influence to outliers and severely limits the reproducibility of these results. Outliers (i.e., subjects with gene expression profiles markedly different from others in the same group) are particularly likely here since the authors seem to have grouped different cancers and different adverse events into the same catch-all groups.
The number of differentially expressed genes in an RNA-seq experiment generally increases with the number of biological replicates. The authors don’t provide exact numbers of differentially expressed genes, but their Figure 1 implies that they could number in the thousands for each comparison. These plots also show adjusted p-values as low as 10^-80 (adverse vs control) and 10^-250 (cancer versus control). I doubt that you could get results with this many differentially expressed genes and p-values this low with so few replicates.
I could be wrong—I have experience comparing small groups to each other but don’t have experience comparing one small group to one large group. Some modeling could confirm if p-values this low are even mathematically possible under these conditions. Better yet, we can investigate the raw data the authors of this preprint have shared! Well, no so fast…
3. No data is made available
Thanks to the dogged efforts of open science advocates, nowadays most published (and preprinted) RNA-seq studies make the raw data publicly available. This raw data might take the form of the raw .fastq files containing the sequencing “reads”, the processed gene count matrix, normalized expression matrix, tables of differential expression results, or any combination thereof. These files can be quite large, but fortunately there is a lush ecosystem of services for depositing and hosting large datasets. The Gene Expression Omnibus (GEO) and the European Nucleotide Archive (ENA) are two widely-used services that specifically host genomics data and give every entry an accession number. If you want to tell your readership where they can find your data, you can just state which platform is hosting the data and provide the accession number.
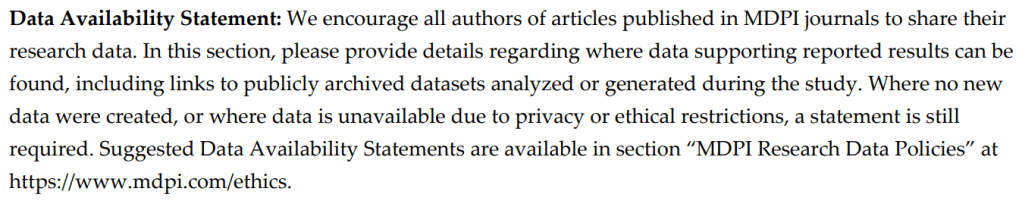
The authors of this preprint do not share any of their sequencing data or point to where this data is available, making it impossible to further probe their results. The preprint’s Data Availability Statement is identical to the placeholder in the Microsoft Word templates MDPI provides for submissions to their journals.
Sharing the raw .fastq files is not always possible in human studies (you can learn enough about someone’s genetic variations from RNA-seq data for sharing raw reads to constitute a privacy risk), but there’s nothing stopping you from sharing processed data, including count matrices. Sharing your sequencing data makes your work more transparent, but it also gives your data a second life: now, scientists anywhere can download and re-analyze your sequencing data for their own studies! If you publish a particularly large or otherwise useful dataset, many will. I’d bet most articles coming out nowadays that use RNA-seq data do not generate their own sequencing data and instead use publicly available datasets.
4. Where did all this sequencing data come from?
RNA-seq is expensive and 813 bulk RNA-seq samples is, in technical terms, a lot. The authors claim to have performed their sequencing at the University of North Texas (UNT) Genomics Center, which charges external clients $250 per sample for the sample preparation protocol the authors describe and $7,005 for every sequencing run on the instrument the authors describe (each sequencing run would process 16 samples according to the instrument’s spec sheet). For 813 samples, this comes out to more than $550,000 for sequencing alone (if my math is correct).
The preprint’s corresponding author, John A. Catanzaro, has since clarified in a comment on Elisabeth Bik’s blog post that samples from the control group “are not new blood draws. These are publicly available RNA-seq datasets derived from healthy, non-diseased individuals collected prior to the COVID-19 pandemic”. He provides no additional clarification as to which dataset this actually is (again, no link, dataset name or accession number provided). However, there are few existing bulk RNA-seq datasets that collected this many samples from a single tissue sampling site and I’m almost certain that they used the GTEx Whole Blood dataset, which has exactly 803 samples [EDIT 28 July 2025: Catanzaro has confirmed this in a comment on the preprints.org platform].
This is information that should have been in the preprint. The preprint, in its posted form, gives the impression that the control group samples were, in fact, new blood draws. The “Patient Population Characteristics and Sample Collection” section under Materials and Methods describes the case groups and provides a single sentence stating that “a cohort of 803 healthy individuals was used as the reference control group” before detailing the procedure for collecting blood. Leaving out information that clarifies that these 803 samples do not constitute newly-collected data implies that a lot more legwork went into this study than actually did, augmenting the preprint’s apparent credibility.
Catanzaro clarified further in his comment that “[all] 10 case samples were processed at the University of North Texas BioDiscovery Institute” (it’s presently unclear to me if the UNT Genomics Center operates within the UNT BioDiscovery Institute or just closely alongside it. Catanzaro announced a partnership between his company, Neo7Bioscience, and both the Genomics Center and the Biodiscovery Institute in January 2025). If the 803 control samples came from a publicly available dataset and the ten case samples were sequenced at the UNT Genomics Center, then we can account for all claimed samples.
Before I saw Catanzaro’s comment, I reached out to another one of the study’s authors, Minh Vu, director at the Genomics Center at UNT, who would presumably know more about the sequencing. He told me that the UNT Genomics Center had indeed performed sequencing for the study and they had sequenced four samples.
5. Wait, the UNT Genomics Center only sequenced four samples?
According to Vu, the UNT Genomics Center only sequenced four samples, not ten. Beyond the apparent disagreement between these two co-authors, this is worrisome because neither the adverse events group nor the cancer group has exactly four samples. It is plausible that these samples were from the adverse events group and one of the samples wound up being discarded downstream due to contamination or low sequencing quality (which happens). However, that would still leave us with seven missing samples from the cancer group. Vu couldn’t tell me which treatment group the four samples belonged to, if any, since the samples were only labeled with ID numbers when they were received at the UNT Genomics Center.
Vu clarified that his team “sequenced the sample then returned the data. I can answer everything related to the sequencing process but I am afraid we were not too involved in the work afterward”.
6. Who coordinated sample collection?
The Author Contributions statement reads “M.V. [Minh Vu] coordinated sample collection and RNA sequencing”. However, Vu claims to have not been involved before receiving the already-collected samples at the UNT Genomics Center. Based on his role at UNT and his description of his involvement over email, I find it unlikely that he coordinated sample collection. If the identity of the person coordinating sample collection is important enough to include the Author Contributions statement, it’s important enough to get right.
7. The GTEx RNA-seq data is not from “healthy, non-diseased individuals”
The preprint and Catanzaro and Hulscher’s statements outside the preprint repeatedly imply that the control group samples represent healthy individuals. The authors have fundamentally misunderstood the GTEx dataset they use. The samples in GTEx, including the whole blood draws, are from people that have died, collected less than 24 hours postmortem.
Causes of death for these patients listed on the GTEx portal website fall under the headings “heart disease”, “cerebrovascular”, “liver, renal and respiratory”, “neurological” and “traumatic injury”. Knowing the exact causes of death necessitates access to protected data, which I do not have, but GTEx does make a “Hardy scale” score for each patient publicly available, classifying how fast each donor’s death occurred. 430 out of 803 whole blood donors (53.5%) are labeled as having died while on a ventilator. Another 85 (10.6%) are labeled as having died after a long illness.
Donors for GTEx were excluded if they had ever been diagnosed with metastatic cancer and tissue samples were excluded if they showed signs of the tissue itself being diseased (see Carithers et al. 2015). Regardless of these filtering criteria, clearly a large fraction of the donors in GTEx had some condition at death that precludes them from being classified as “healthy individuals”. These conditions are very likely to affect whole blood gene expression profiles and may substantially overlap with conditions present in the adverse events group.
8. GTEx RNA-seq data and the authors’ novel data are not directly comparable
The table below summarizes a few key differences in how the GTEx data and author’s novel sequencing data were collected and processed.
| Step | GTEx | This preprint |
| Library type | Unstranded | Strand-specific |
| Library prep | Poly-A selection | rRNA depletion |
| Platform | Illumina HiSeq 2000 or 2500 | Illumina NextSeq 550 |
| Quantification | RSEM | Salmon |
Note that these procedures diverge on at least four fronts. Any of these differences are likely to affect estimates of gene expression, especially the differences in library preparation (see Chen et al. 2020). While datasets prepared this differently might be comparable via meta-analysis, using these datasets for differential expression analysis would require robust correction for some pretty significant batch effects. In his blog post comment, Catanzaro states that “[since] the 803 controls were computational reference datasets, not new lab samples, no batch effect exists across case versus control in a physical laboratory sense”. I’ll take that to mean that the authors did not attempt to correct for batch effects.
However, correcting for batch effects between these two procedures is effectively impossible for this study design anyway—the separate “batches” align exactly with the separate study groups. Hence, batch effects cannot be meaningfully disentangled from biological variation between the control group and case groups.
9. Colorful interpretation of gene set enrichment analysis results
Extracting analytical conclusions from RNA-seq differential expression experiments involves interpreting changes in expression for tens of thousands of genes simultaneously. Without a framework for understanding what these genes actually do, you are effectively reading tea leaves. Plenty of functional enrichment analysis methods have been developed with the goal of making transcriptomics a little less hand-wavey. Generally, these methods sort genes into pre-annotated “gene sets” containing conceptually linked genes (e.g., genes related to RNA folding, genes whose proteins localize to the nucleoplasm, genes related to Alzheimer’s disease, etc.) and test if there are concerted changes in gene expression that are particularly heavily concentrated in those sets.
This analysis is correlative, not causal. While you might observe that a gene set related to mast cell activation contains a larger-than-expected number of upregulated genes when comparing a treatment group to a control group, this result does not directly imply that there is actually more mast cell activation in your treatment group, nor that the intervention differentiating your two groups caused a change in mast cell activation. Functional enrichment analysis results need to be interpreted cautiously and hypotheses generated from these experiments should ideally be followed up with experiments that more directly assay the cellular processes in question.
The authors of the preprint perform Gene Set Enrichment Analysis (GSEA) on their differential expression results and find a handful of gene sets to be enriched. They claim that these GSEA results are “Categorized by Molecular Pathway Disruptions” without providing evidence that this is the case and then group together the enriched gene sets under “key hallmark categories”, which they title rather suggestively.
Take, for instance, the category titled “Transcriptomic Instability and Translational Stress”. The gene sets contained herein have little to do with transcription and they don’t define what “transcriptomic instability” actually means. “Translational stress” apparently means “sustained activation of protein synthesis machinery”. Elsewhere, Hulscher calls this “ribosomal overload” and suggests that it has something to do with reverse transcription (reflecting their assertion that the vaccine mRNA is reverse transcribed into DNA, which is somehow integrated into the genome). One could only tenuously link these gene sets to any of these processes.
10. The protein-protein interaction networks tell us nothing
Systems biology articles often show images of networks so dense that the eye cannot distinguish which nodes are actually linked (“hairballs” in network science parlance). This preprint does the same for protein-protein interaction networks from the STRING database, limited to just a selection of the genes they find as differentially expressed. It’s not clear what these protein-protein interaction networks are supposed to tell us, other than that these are in fact proteins and they do in fact interact. The preprint does not elaborate on them.
11. The authors compare the adverse events group and cancer group without actually comparing them
The authors spend a large part of the Discussion section comparing their GSEA results for the control/cancer comparison against their GSEA results for the control/adverse events comparison. There is a better way to assess differences in gene expression between the cancer group and the adverse events group: actually comparing them with differential expression analysis. If I wanted to compare the taste of pears to the taste of apples, it would make a lot more sense to compare them directly instead of pondering the ways in which each of their flavor profiles uniquely differ from that of the jackfruit.
12. Lots of essential information is not reported
The preprint fails to provide information on myriad important experimental factors, including, but probably not limited to:
- What were the demographics of the subjects in each group?
- When, where and how were subjects recruited?
- Adverse events were said to manifest “shortly after vaccination”. How long after vaccination did these symptoms appear?
- Cancers were said to manifest “as a new-onset condition within a short time frame following mRNA vaccine administration”. How long after vaccination were patients diagnosed with cancer? Catanzaro states in his blog post comment that “cancer diagnoses occurred within 12 months of mRNA vaccination”. However, the conclusions section of the preprint alludes to “transcriptomic evidence of molecular disruptions…months to years following COVID-19 mRNA vaccination”.
- Exactly which symptoms did each adverse events subject have? The preprint provides a list of more symptoms than there are subjects in the adverse events group.
- What kind of cancer were the cancer subjects diagnosed with? In what clinical stage of cancer were these subjects when they were recruited?
- When were blood samples collected relative to times of vaccination, diagnosis/symptom onset and recruitment?
- How many vaccine doses did these subjects receive and from what manufacturer?
- How many RNA-seq samples were discarded due to contamination or low sequencing quality?
- When the authors used GTEx data, were they working with the publicly-available gene count tables or the protected-access raw .fastq files?
- Did the authors align sequencing reads against and quantify expression of all human genes or only human protein-coding genes?
- How did the authors ensure that the subjects in each group were demographically similar enough to meaningfully compare against each other?
- How did the authors ensure that their recruited subjects were demographically similar enough to the GTEx whole blood donors to meaningfully compare them? Note that 26 out of 803 GTEx whole blood donors (3.2%) were older than 70, which the authors describe as the maximum age allowed for the participants they recruited.
As detailed previously, the authors have offered partial answers to some of these questions in social media posts, blog comments and private emails. However, a paper’s readership should not have to traverse a web of one-way links to arrive at vital information that is normally presented in the Methods section.
13. Probable conflicts of interest are not reported
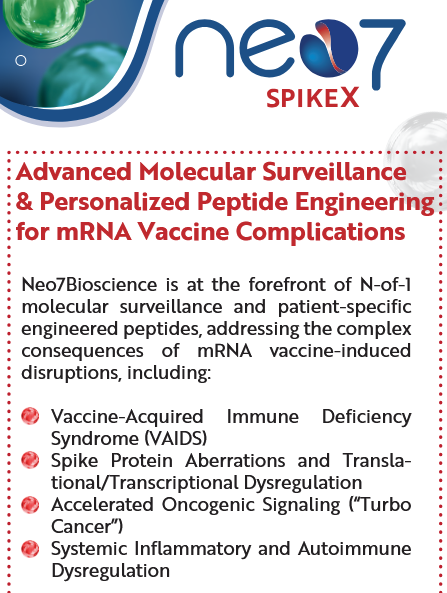
The preprint’s Conflicts of Interests statement leaves out a couple of relevant details. For one, Neo7Bioscience, the company for which Catanzaro is CEO, advertises personalized peptide therapies to treat “mRNA Vaccine-Related Injury and Complications”.
Moreover, Peter A. McCullough, MD, MPH® is the Chief Scientific Officer of the Wellness Company, a supplements vendor that sells expensive “spike detox” capsules endorsed by McCullough and “emergency health kits” containing ivermectin, azithromycin and hydroxychloroquine. As noted by Kevin Patrick in a comment on the preprints.org platform, McCullough declared his relationship with this company in another article’s Conflicts of Interest statement last year.

If you plausibly stand to profit from convincing people that mRNA vaccines cause adverse events, this is relevant information to put in your Conflicts of Interest statement in your preprint arguing that mRNA vaccines cause adverse events.
14. Ethical approval and informed consent issues
The study was apparently approved by five different Institutional Review Boards (IRBs) from five private clinics in Florida, Texas, California and Georgia.
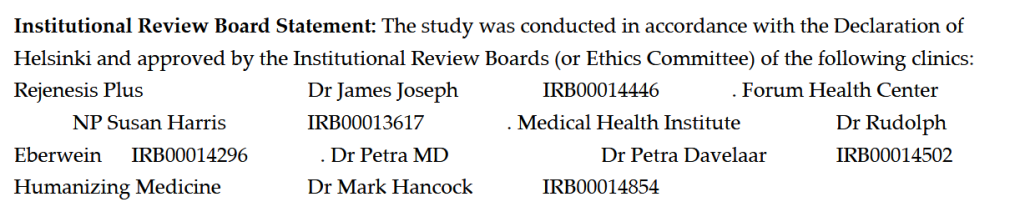
This raises another panel of questions: How were each of these clinics involved in the research? Why was permission sought from five different IRBs? Do these clinics even have IRBs? Are the people listed here members of these IRBs? If so, who are the other members of these IRBs?
Most of the clinics listed here are also listed as “providers” on Neo7Bioscience’s website, but the nature of the business relationships between these clinics and Neo7Bioscience is unclear. Also: the website of Petra Davelaar, one of the people listed here, implies that she began working at Neo7Bioscience as an “investigator for their personalized pooled peptide therapies” in 2024!
Further still, each of the IRB numbers shown here do in fact link to real IRB registrations on the website of the United States Office for Human Research Protections, but the IRB number provided for “NP Susan Harris” at “Forum Health Center” (presumably this clinic in Coppel, Texas) instead points to an IRB at Dayspring Cancer Clinic in Scottsdale, Arizona.
The preprint states that “[all] participants provided written informed consent prior to inclusion in the study”. However, in his blog post comment, Catanzaro states that subjects “were enrolled under informed consent as part of personalized medicine investigations already in progress. RNA-seq was integrated as part of their diagnostic and monitoring strategy, not for detached academic purposes”. When these participants gave their consent, did they know that their sequencing data would be used for research or shared with external researchers?
The authors could clear up these issues by sharing what the informed consent forms looked like when they were shown to potential study participants and by sharing these IRB approval documents.
15. Reporting errors
The preprint has numerous reporting errors and inconsistencies. In both tables, false discovery rate (FDR) values lower than 0.001 are listed as “>0.001”, not “<0.001”. In Table 1, one of the listed FDR values is negative (FDR can only fall between 0 and 1). At one point, the authors claim that they called statistical significance at FDR < 0.05, but later they claim that they called statistical significance at a weaker threshold of FDR < 0.25. Table 1 and 2 show several gene sets that are only significant at this weaker threshold. The reference list is also riddled with inexplicable typos in authors’ names.
16. Finally, plagiarism
Most of the “Protein-Protein Interaction Map” section under Materials and Methods is apparently copied word-for-word from Hanes et al. (2023).
![The text "STRING is a
database of known and predicted protein–protein interactions that includes both physical and
functional protein associations. The STRING database currently covers 24,584,628 proteins from 5090
organisms [30]. STRING generates a network from an input list of proteins based on associations
from a variety of data sources including genomic context predictions, high-throughput lab
experiments, automated text mining, and previous knowledge in databases [31]. The network can be
viewed within STRING or exported for visualization and analysis outside of STRING; for example,
the network can be exported directly to Cytoscape." is shown in both von Ranke et al. and Hanes et al.](https://reeserichardson.blog/wp-content/uploads/2025/07/miau-1.png?w=1024)
Summary
MDPI should withdraw this preprint. I’d wager that the authors won’t do it themselves.
[ UPDATE: 11 September, 2025 ]
MDPI has withdrawn the preprint! The withdrawal notice simply remarks that the preprint “has unresolved ethical issues”. Predictably, the authors claim that they are being censored.
[ UPDATE: 12 September, 2025 ]
MDPI has updated the withdrawal notice to state that the preprint “has unresolved ethical issues concerning ethical oversight, legitimacy of institutional boards, validity of the study design, and potential biases in study interpretation that compromise the overall trust in the research findings”.
[ UPDATE: 17 September, 2025 ]
MDPI has again updated the withdrawal notice. It now reads: “This preprint is withdrawn and removed from the Preprints.org website at the request of Advisory Board in line with the withdrawal policy(https://www.preprints.org/instructions-for-authors#withdrawal-policy). As such, the title, author information and this withdrawal statement will remain permanently available, and the article itself has been removed. This information has also been transmitted to relevant indexing organizations”.

Leave a reply to Peter Cancel reply